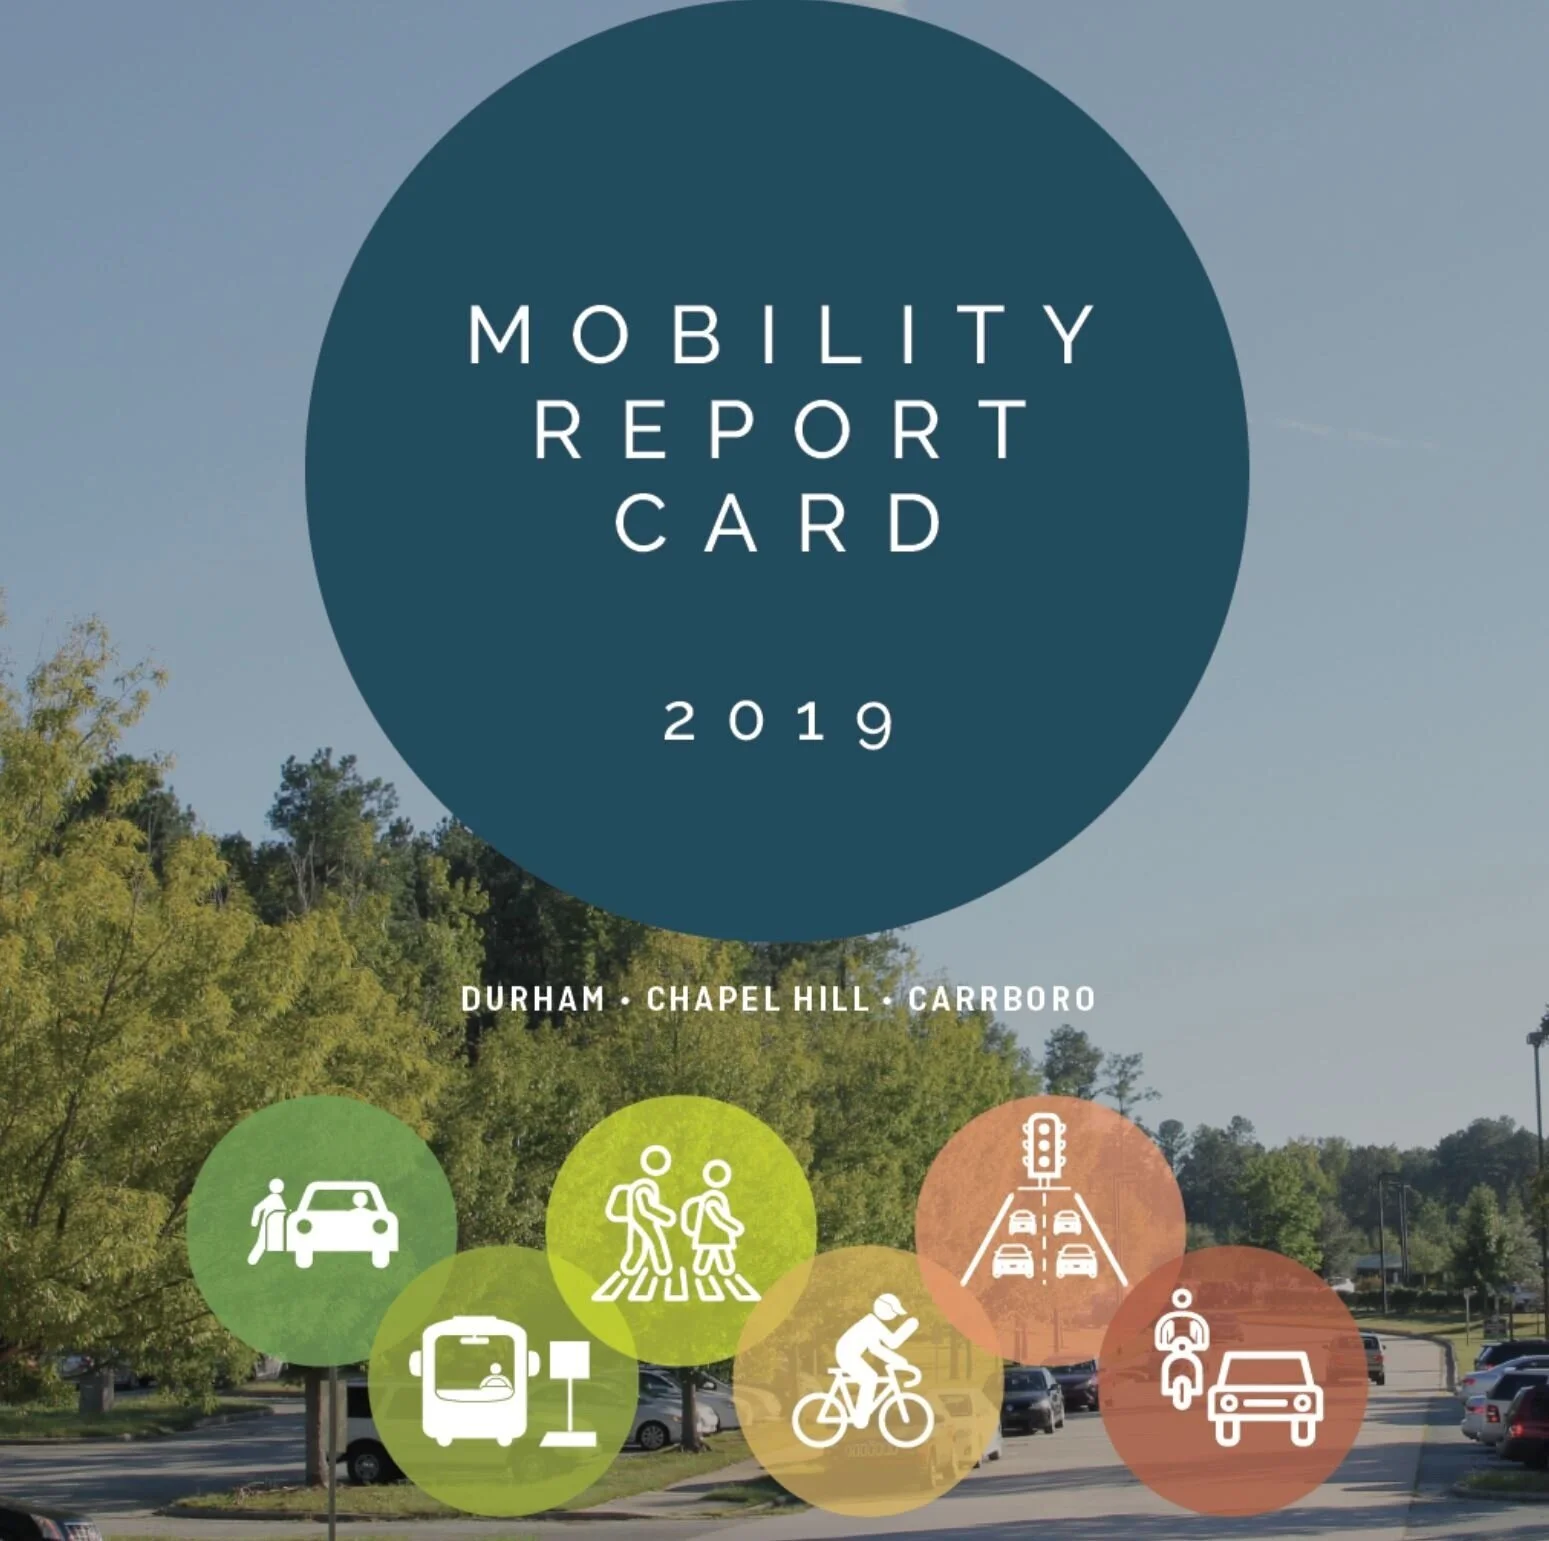
This is the kind of report card that I’m excited to see.
The interactive and highly visual data dashboards within the Mobility Report Card for the Durham-Chapel Hill-Carrboro (DCHC) regional MPO helps to clearly tell the story of multimodal transportation performance, reliability, and safety for the Triangle Region.
“This went from a large, complex dataset that was sitting on a shelf – in a thick paper report – to something that people can interact with” says Alex Bell, Project Manager and Technical Director for Renaissance Planning. “There are limited opportunities for innovation in the world of transportation performance metrics where the data and analysis methods are often highly codified. But with the Mobility Report Card we were able to make the data visible, interactive, more accessible, and easily understandable to a wide range of real users and public groups – and the DCHC MPO were very happy as well.”
Data around transportation systems are usually collected and synthesized into large paper reports that are often both difficult to understand and not easy to access by the general public. But this report – with its clear story map website, easily digestible chapters, and interactive data dashboards – provides clarity on the far side of complexity. To learn more about this project visit the Mobility Report Card Project Page.
Watch the Q&A with Alex has he provides a guided tour of the Mobility Report Card. I give it an A+.
- By Asa Eslocker with Alex Bell

